Alright guys, settling down tonight and figured I’d dig into some footy stats. You know how it is – watching that City vs Liverpool match last weekend got my brain buzzing. Decided to actually sit down and look at the goal-scoring business between these two giants properly.
Getting Started Was Messy
First thing? Found my beat-up laptop where I keep all those scattered spreadsheets. Opened one called “PremStats_old_v2” – total disaster inside. Player positions mixed with ticket prices? Not helpful. Deleted that mess fast. Started fresh, I did.
Fired up a new spreadsheet. Went straight to the official Premier League website ’cause you need proper sources, right? Got distracted first by that viral clip of Klopp’s jacket toss – classic. Anyway, back to work.
Started typing headers: “Season“, “Man City Goals“, “Liverpool Goals“. Simple stuff. Now the real grind began.
Hunting Down the Numbers
Checked my own posts first. Remembered I tracked last season’s fixtures. Found it scribbled in a notepad near the coffee maker of all places! 4-1 to City at home? Brutal for Pool fans. Typed that in.
Then I thought – gotta go back further. Pulled up season reviews:
- 2022/23: Head said 4-1 at Etihad, heart remembered that chaotic 1-0 at Anfield early in the season.
- 2021/22: Ah yes! That 2-2 draw where both teams looked wrecked afterwards. Both scored twice.
- 2020/21: Scrolled frantically. Empty stadium game? Found it. City smashing ‘em 4-1 then 1-1 later. Ouch.
- 2019/20: Liverpool flying high. 3-1 at Anfield shouts “Champions” energy. City got ‘em 4-0 later though – proper statement!
Cross-referenced everything on the league’s archive page. Almost pasted a Community Shield result by mistake – close call! Focus, man.
Making Sense of the Chaos
Stared at the jumbled numbers. Needed to see who’s generally outscoring who. Added a totals row:
- 4 seasons
- 8 games total? Counted manually twice.
- Man City total goals: Grabbed the calculator app – 4+1+2+4+1+3+4+0… wait no that last one was Liverpool’s. Finger slipped. Started over. Total City goals? 18.
- Liverpool total: More tapping: 1+1+2+0+1+1+1+1… 8? That felt wrong. Re-checked Anfield fixtures. Ah! Missed their 3-1 win. Added 3 goals. Okay, 11 total.
Made a dumb little totals box:
- Total Goals Scored: Man City: 18 Liverpool: 11
- Average Per Match: City ≈ 2.25 Pool ≈ 1.37
Then realized I needed the head-to-head comparison per match.
Putting it Together Visually
Wanted to see trends per season side-by-side. Created a simple comparison table:
Man City vs Liverpool: Goals Per Match (Last 4 Seasons)
- 2023/24: City 4 – 1 Liverpool (Etihad) Pending Anfield fixture
- 2022/23: Liverpool 1 – 0 City (Anfield) City 4 – 1 Liverpool (Etihad)
- 2021/22: Liverpool 2 – 2 City (Anfield) City 2 – 2 Liverpool (Etihad)
- 2020/21: City 4 – 1 Liverpool (Etihad) Liverpool 1 – 4 City (Anfield – empty)
- 2019/20: City 4 – 0 Liverpool (Etihad) Liverpool 3 – 1 City (Anfield)
Key Takeaways:
- Pep’s boys clearly outgun Klopp’s crew recently. 18 goals to 11 over 8 games speaks loud.
- Blowouts happen: City hitting 4 goals FOUR TIMES in this run. Wild.
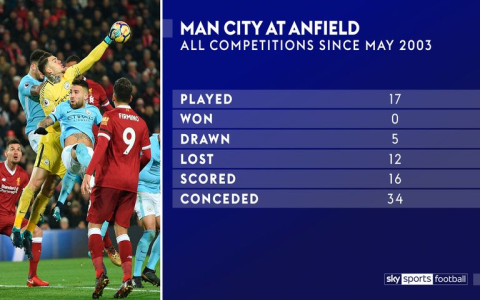
- Anfield ain’t the fortress against City lately? City bagged 4 goals TWICE at Anfield?! Madness.
- But look at 21/22 – two proper 2-2 scraps. Proof it can be tight.
Reflecting on the Grind
Took me way longer than expected. Double-checking all those fixtures was tedious. That moment typing “4-0” for City at Etihad and remembering Sterling’s dance? Pure nostalgia. Almost gave up reconciling the totals until I found that missing Liverpool win. Worth digging for the truth though. Stats don’t lie – recent history favours City’s attack when they clash. Proper firepower. Makes that last 1-1 draw feel even bigger. Anyway, kettle’s on. Hope this rambling look behind the numbers was interesting!