
Yesterday, AC Milan played Lecce away, and I watched the live broadcast. Milan won the game, but it looked pretty tense. After the game, I was curious: did Milan really play well, or was Lecce just unlucky? So I looked up the detailed statistics for the game to see for myself what really happened.
I opened the data website and immediately looked at the most commonly mentioned numbers:
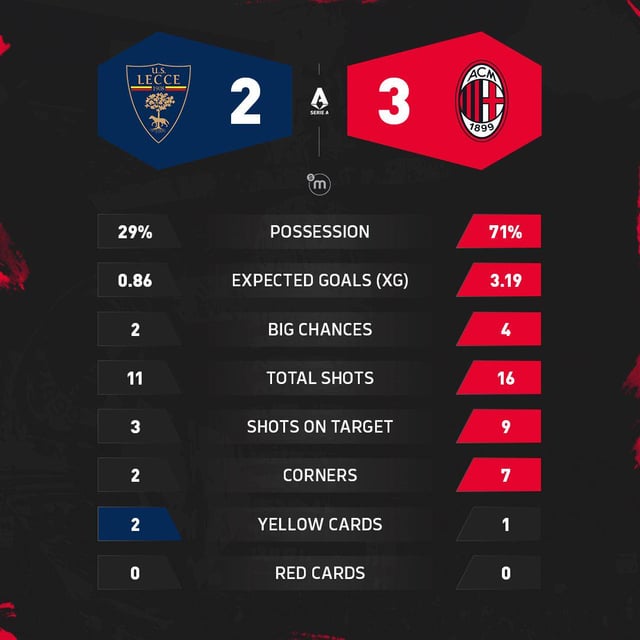
Possession: AC Milan had 63%, while Lecce only had 37%. This isn’t surprising, as Milan has always preferred to control the ball.
Shots: Lecce had 14 shots, while Milan only had 10. Huh? The team with less possession actually took more shots? This confused me a bit.
Corners: Milan had 7, while Lecce only had 2. This indicates that Milan frequently sent the ball into the opponent’s penalty area.
Looking at the total number of shots can be misleading. I looked at the shot location chart and discovered a big problem.
Most of Milan’s shots were inside the penalty area, especially near the center of the goal. Shots from these locations have a high chance of scoring.
Many of Lecce’s shots were taken from far outside the penalty area, some even close to midfield. These shots were more like “try-outs,” with the outcome depending entirely on luck.
I came across a statistic called “xG,” which stands for “expected goals.” It doesn’t look at the result, but rather the probability of each shot going in.
Milan’s xG was 2.1, while Lecce’s was only 0.6. This means that Milan created 3 to 4 times more good chances. Although they took fewer shots, each one was more dangerous.
This data made me realize that taking a lot of shots doesn’t mean you’re playing well. The key is to shoot in the right place.
Lecce’s goalkeeper was very busy in this game. The data shows that he made five saves, three of which were difficult saves.
Milan’s goalkeeper only made one save, and it was a very easy one. This shows that Lecce hardly threatened the opponent’s goal.
The workload of the goalkeeper directly reflects which side is attacking and which side is defending.
I noticed that Lecce committed 12 fouls and received 4 yellow cards throughout the game. Milan only committed 6 fouls and received no cards.
What does this indicate? Lecce relied heavily on physical confrontation, with many fouls aimed at disrupting Milan’s attacking rhythm.
This was especially evident in the second half, when Milan launched a series of attacks and Lecce players had to pull and trip their opponents to stop them. This is actually a common tactic used by weaker teams.
Milan’s pass completion rate for the entire game was 88%, and it was as high as 92% in the opponent’s half. They were able to pass the ball steadily to the front without losing possession easily.
Lecce’s pass completion rate was only 76%, and they often made mistakes once they crossed the halfway line. As soon as they lost the ball, Milan counterattacked, putting pressure on Lecce.
This shows that Milan not only had more possession but also passed accurately, delivering the ball into dangerous areas.
I checked the substitution times. Milan replaced their forward and midfielder around the 60th minute, clearly aiming to strengthen their attack.
After the substitutions, their shots were more concentrated and the pace was faster. The goal in the 75th minute was scored after a combination play following the substitutions.
Lecce also made substitutions, but they were mainly defensive, with the goal of protecting the score and not daring to attack.
From the data chart, Milan’s attacks mainly came from the left side. Their left back and left winger worked together a lot, often breaking through on the wing and crossing the ball into the box.
Lecce, on the other hand, relied mainly on long passes to their forwards, aiming for quick counterattacks. However, due to their lack of control in midfield, most of their long passes were intercepted.
This style of play is difficult to succeed against strong teams, especially when the opposition’s defense is well-organized.
Now I understand: Lecce had more shots because they had to take risks when they were behind. The later the game went on, the more they pushed forward, leaving their defense exposed and allowing Milan to capitalize on their opportunities.
Most of their shots were long-range attempts or half-hearted efforts, lacking in quality. The data doesn’t lie—low xG means poor opportunities.
Overall, Milan’s victory was not surprising at all. They controlled the pace of the game, created high-quality chances, put little pressure on the goalkeeper, and the players didn’t get any cards.
Although they had few shots on goal, each attack was more threatening. This is how a strong team performs: they don’t rely on luck, but on their strength to gradually overwhelm their opponents.
This game taught me one thing: don’t just look at the surface numbers. More shots don’t necessarily mean better play, and high possession doesn’t necessarily mean effective play.
The key is to look at:
- Where did the shots come from?
- How many saves did the opposing goalkeeper make?
- Which team committed more fouls?
- Did the passes reach dangerous areas?
These details truly reflect the state of the game.
Next time you watch a game, check the statistics. You don’t need to understand complicated terms, just look at a few simple ones:
Who’s shots were closer to the goal?
Which goalkeeper was busier?
Which side committed more fouls?
What happened after the substitutions?
You’ll find that the story of the game is much more interesting than the score.
Lecce played well in this match, showing determination and creating several opportunities. However, against a team like Milan, determination alone isn’t enough; better technique and tactics are also needed.
Milan proved with the data that they were the more deserving winners. Football isn’t just about who takes more shots; it’s about who can get the ball into the most dangerous areas.