
Alright so here’s the deal – I woke up thinking about Egyptian football clubs this year. Realized I couldn’t compare team stats without digging through multiple pages like some damn detective. Ain’t nobody got time for that, right?
The Scrolling Nightmare Begins
First I opened up five different browser tabs for league tables – each one slower than the last. My finger got tired scrolling past player photos, transfer rumors, and those stupid pop-up ads for football jerseys. Thought about screaming when the fourth page froze while loading.
Excel or Suffer
Punched “Egyptian Premier League standings” into Google and got twelve different sites showing partial data. Copied the messy tables straight into Excel sheets. Ended up with:
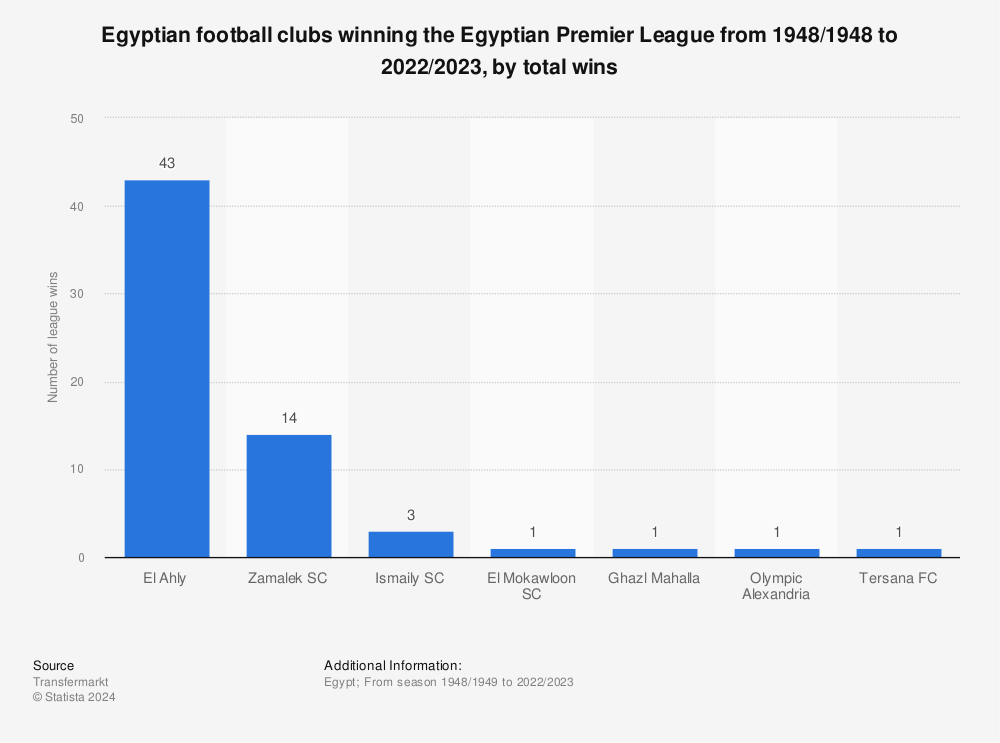
- Club names spelled three different ways (Al Ahly / Al-Ahly / الأهلي)
- Random Arabic characters mixed with English
- Extra spaces everywhere like confetti
The Cleanup Wrestling Match
Spent 40 minutes doing this crap:
- Used TRIM() to murder extra spaces
- Made SUBSTITUTE() my bitch for fixing name variations
- Built custom columns for points-per-game calculations
Highlight Reel Surprises
When the mess finally looked like actual data, sorted clubs by win percentage. Couldn’t believe my eyes – three teams fighting relegation actually had better defense than top-half clubs! That’s why raw points lie sometimes.
Pro tip: Always track goals against. Found this little-known club conceding fewer goals than Al Ahly when playing away. Mind = blown. Would’ve missed that doing manual checks.
Cheap Trick Saves the Day
Made one last column dividing goals scored by shots taken. Wanted to see who wasted opportunities. The numbers shamed three big clubs immediately. Imagine spending millions on strikers who can’t finish better than relegation battlers. Embarrassing.
Epiphany Moment
Data cleanup sucks worse than extra time in desert heat. But finding those hidden patterns? That’s the crack cocaine of sports analysis. Still shaking my head at how wrong my preseason predictions were.